CS 6360 Virtual Reality- Assignment 2
Zach Gildersleeve
February 16, 2007
Comparison of Tracking Technologies
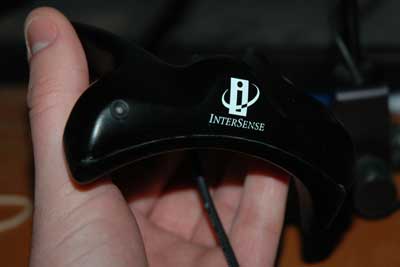
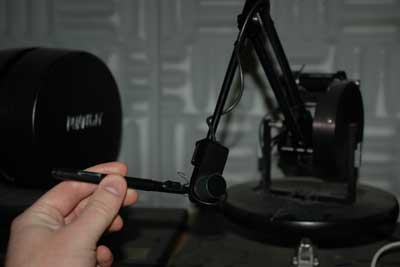
This project focuses on current tracking technology, specifically the Constellation based InterSense inertial/acoustic tracking system. For comparison purposes, this tracker (iSense) will be benchmarked against a SensAble Phantom haptics device, which we will assume to have zero error, although we will test this assumption as well. The below images illustrate the iSense tracker device, and the Phantom device, left to right.
The first step in this project is to connect to the iSense tracker via the InterSense provided libraries, and to render a cube in an OpenGL window. This is done by referencing data.Station[station-1].Position and data.Station[station-1].Orientation for positional values and Euler rotational angles. Using these coordinates as the positional values for the cube allow for cube movement via the tracker, once the coordinate system was aligned for the computer display, and scaled to represent a human arm's degree of freedom bounded in the window. As the Euler values are used, the object's rotation occasionally experiences gimbal lock, although it practice this was observable only in rotation around the x axis. As the lock occurs when the user would essentially be standing on their head, it is not a practical problem.
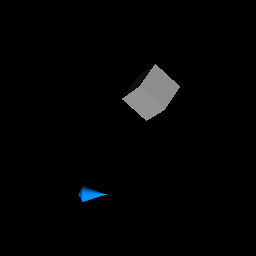
The following image represents the cube in the process of translation and rotation.

Using code from SimpleHapticsScene.c, which essentially does the equivalent process for the Phantom device but draws a pointer glyph, the two devices can be combined in the same OpenGL window, and operate independently at the same time. Some scaling was necessary to allow for similar movement, or at least to constrain movement within the single window. The iSense default positional unit is the meter, and so scaling the iSense position by 10.0 allowed to roughly keep both objects in the window at the same time when moving together.
Finally, adjusting the iSense coordinate system again to match the Phantom coordinate system allowed for direct comparison of the two tracking devices, although the resulting data is still not scaled correctly together, as we shall see and correct for. A glut menu allows for resetting of the iSense coordinate system (used mostly for debugging and not for the actual data), to start and stop recording the positional data from both devices to an external data file, and to adjust the iSense prediction value by steps of 10 in the range 0-50. Each device's positional coordinate is written during the same OpenGL buffer swap, which we assume to be nearly instantaneous and thus identically timestamped.
Data Acquisition and Exploration
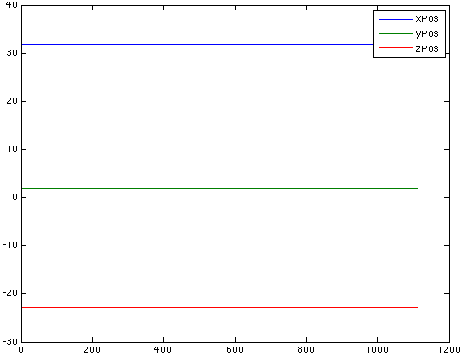
The first step in the comparison between these two objects was to watch their behavior in a static setting, simply placed on a desk and not moving. As might be expected, the Phantom device is essentially noise free, while the iSense tracker experiences a small degree of noise and what is assumed to be uncorrected inertial drift.
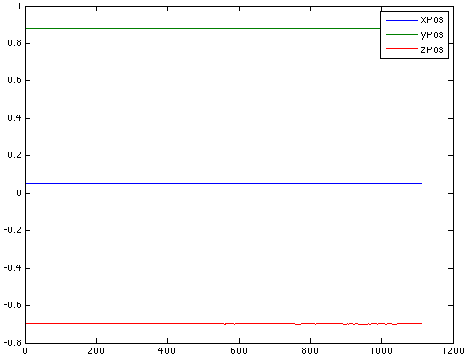
Static iSense positional data, prediction(p) = 50
Static Phantom positional data
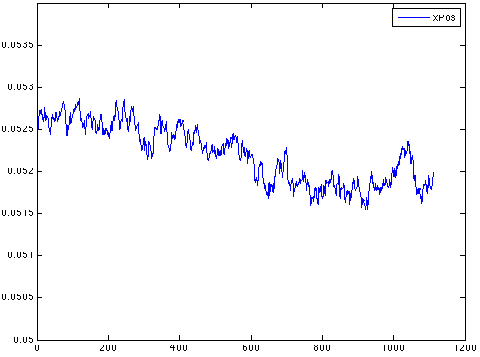
Static iSense positional data, p=50, magnified 450x
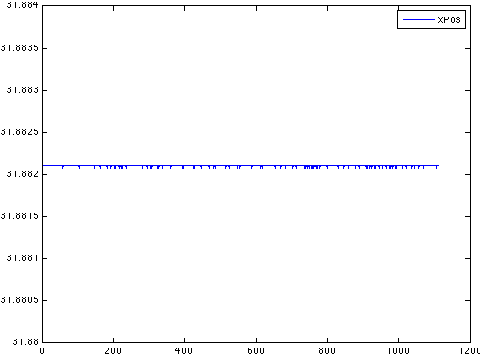
Static Phantom positional data, magnified 450x
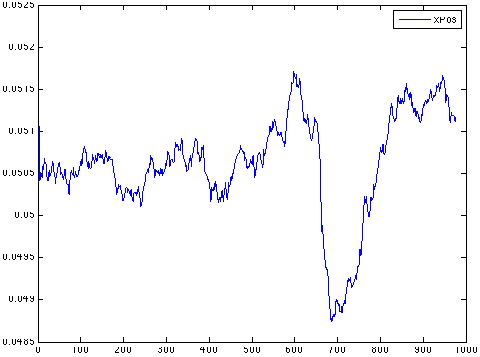
As we can see, even at a vastly magnified scale, the Phantom device experiences essentially no noise, especially compared with the iSense tracker. It appears the Phantom may even threshold its positional recording to avoid any additional noise. Also, for comparison, the below image is the static data from the iSense, with a prediction value of p=0. Note that the general slope of the noise is positive versus the negative slope of p=50, but this may be insignificant. There is no appreciable difference at a static position among the possible prediction values. The big dip in the p=0 static level was also recorded by the Phantom, and thus the table got bumped or some similar event.
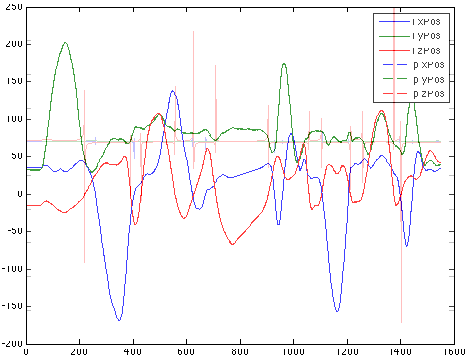
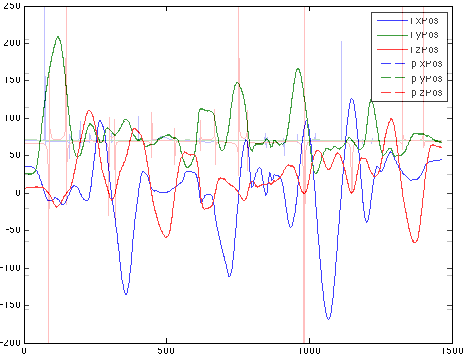
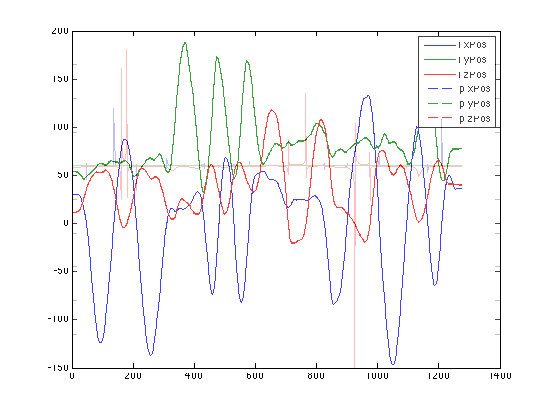
To compare the devices under dynamic, moving conditions, it was necessary to first scale the iSense data to match the Phantom data. Assuming that the Phantom device offers a noise free environment, the iSense data can be scaled off the Phantom device. Thus, the below plots reflect Phantom vs (Phantom + iSense) values. For p=0, we see that the two devices essentially follow each other.
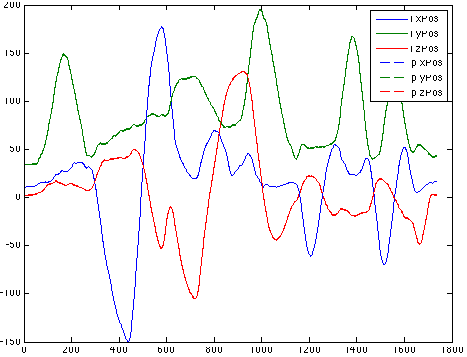
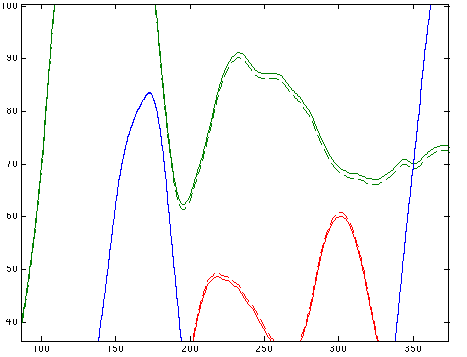
Indeed, the difference between the two devices is not easily visible. However, if we zoom in, there is some areas where the iSense data (solid line) does not reflect the "true" Phantom data (dashed line.)
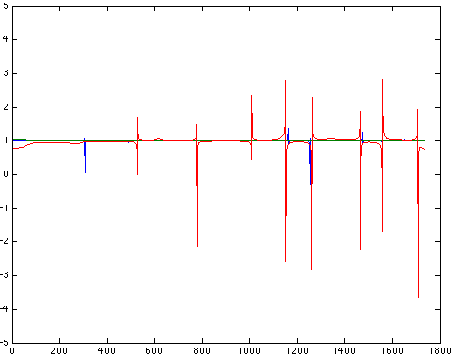
To graphically understand the relative distance between the two devices, we plot (Phantom + iSense) / Phantom. If the two devices matched up exactly, we would expect this plot to be a horizontal line at y = 1. Any deviance from this line represents error between the two devices, and the magnitude of the error is the magnitude of the line above or below y = 1. For p=0, this is illustrated below.
Finally, to understand this error in relation to the positional data, we scale up and superimpose this error graph over the original positional data.
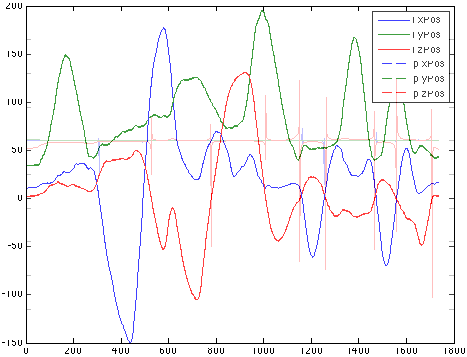
It becomes clear that the error is introduced at points of high velocity, acceleration, and deceleration. At these points, the iSense tracker does not mirror the Phantom device. We assume this is due to the inertial factor in the iSense tracker, which requires non-instantaneous processing to account for, although the iSense tracker is brought back to alignment very quickly. The error plot also illustrates that the iSense tracker experiences a small amount of "sloshing" during the inertial correction.
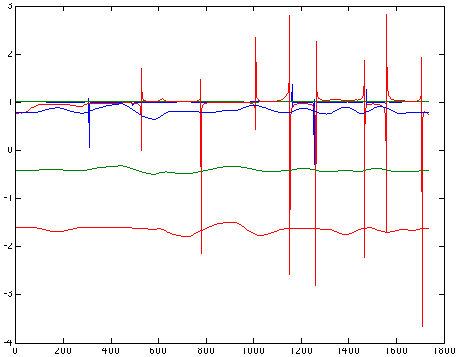
Below are the remaining data results for different prediction values.
p=10
p=20
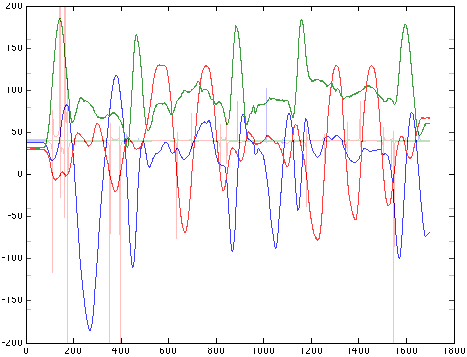
p=30
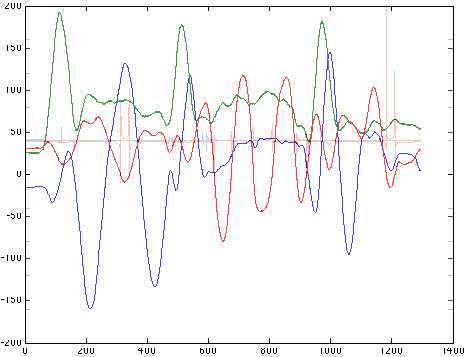
p=40
p=50
The effects of changing the prediction value are subtle. If we examine the error plots compared to the gradient of the originating positional data, we see that an increase in the prediction value from 0 to 50 does slightly reduce the sloshing created by accelerations. Note that the error associated with p=50 from time 200 - 700 is drastically reduced for positional data that is similar to the data with p=0. The overall occurance of error is reduced, but specific instances of error are similar in magnitude across prediction values.
p=0
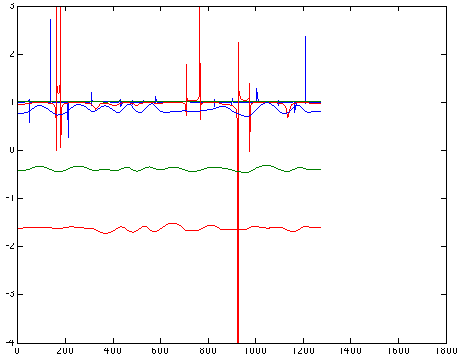
p=50
In conclusion, the InterSense tracking device performs quite well when compared to the noiseless Phantom device. Most error between the two device's positions are introduced during periods of acceleration or high velocity, when the InterSense tracker experiences latency behind the position of the Phantom device.